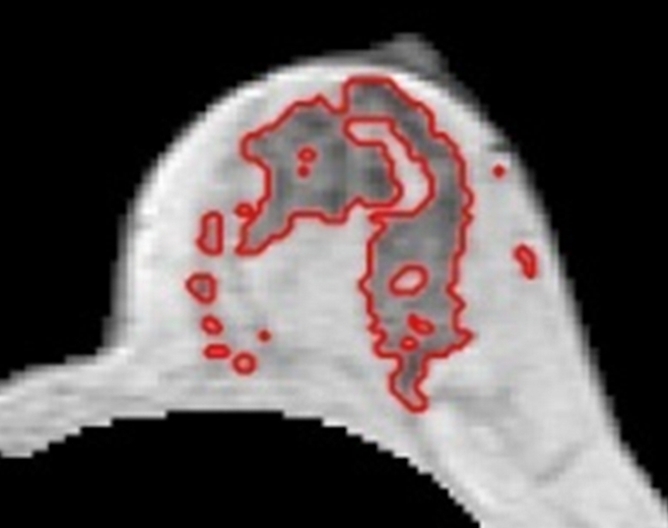
Figure 6a:

(a–d) Representative MR images in 57-year-old postmenopausal subject. Compared with the premenopausal subject in Figure 5, the breasts are fattier. The measured FVs from (a) week 1, (b) week 2, (c) week 3 to (d) week 4 are 21.0, 21.2, 20.6, and 19.9 cm3, respectively. The corresponding PDs are 9.4%, 9.7%, 9.6%, and 8.7%, respectively. CVs for FV and PD are 2.8% and 4.6%, respectively.
