
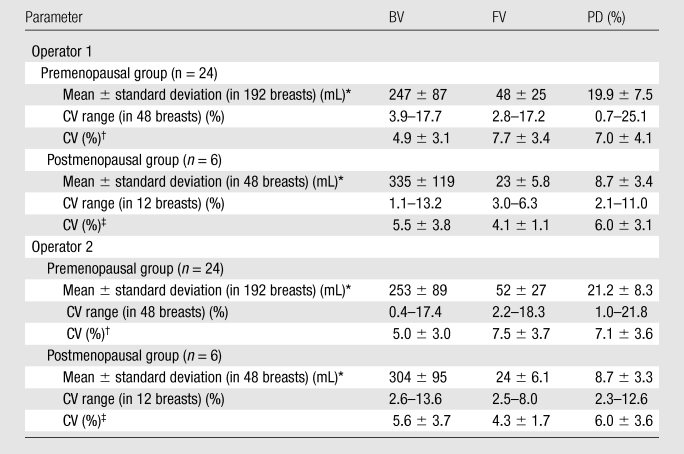
Table 2.
BV, FV, PD, and the Range and Mean of CV Measured from Four MR Examinations during a Menstrual Cycle
*
Mean ± standard deviation are calculated on the basis of all analyzed breasts from four MR imaging studies.
†
Data are means ± standard deviations among 48 breasts.
‡
Data are means ± standard deviations among 12 breasts.