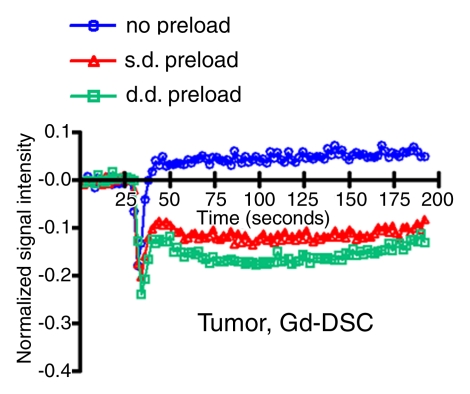
Figure 3a:
Signal intensity–time curves compare DSC perfusion with (a, c) gadodiamide (Gd) and (b, d) ferumoxytol (Fe) in (a, b) tumor and (c, d) normal brain. When gadodiamide is used without preload, contrast agent extravasation in the tumor results in an increase in signal intensity above that at baseline (a). With single-dose (s.d.) or double-dose (d.d.) contrast agent preload, residual T2* effect can be seen as a signal intensity decrease after the first pass of contrast agent bolus. All of the above confound accurate measurement of tumor blood volume. No difference is seen in signal intensity–time curves in the region of brain with intact BBB (c). With ferumoxytol, signal intensity–time curves are the same with and without preload in tumor (b) and normal brain (d), suggesting that there is no extravasation of contrast agent bolus in regions with either disrupted or intact BBB.

