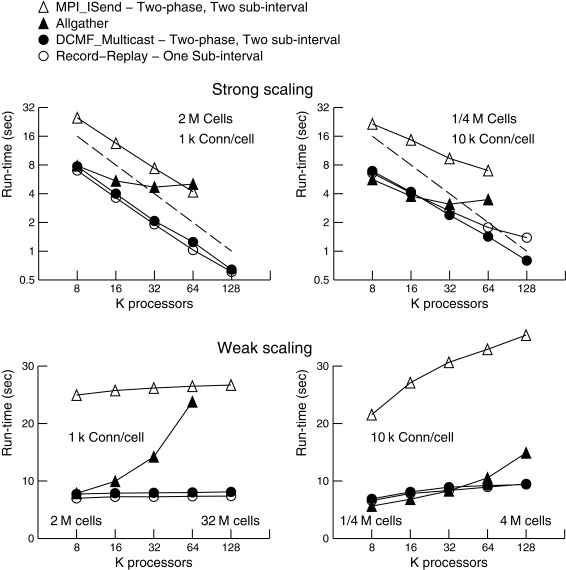
Figure 4.
Strong and weak scaling performance for 1 k connections per cell (left) and 10 k connections per cell (right). For strong scaling 2 M and 1/4 M cells were simulated, respectively. For weak scaling, the number of cells was proportional to the number of processors used and ranged from 2 M to 32 M cells and 1/4 M to 4 M cells, respectively. The number of processors used ranged from 8 K to 128 K. Filled triangles show the performance (real time seconds for a 200 ms simulation) for the Allgather method (one sub-interval). Open triangles are for the MPI_Isend two sub-interval, two-phase method. Filled circles are for the DCMF_Multicast two sub-interval, two-phase method. Open circles are for the Record-Replay DCMF_Multicast method with one sub-interval and one-phase. Note the log-log scale for strong scaling with a dashed line indicating the ideal scaling slope of −1.

