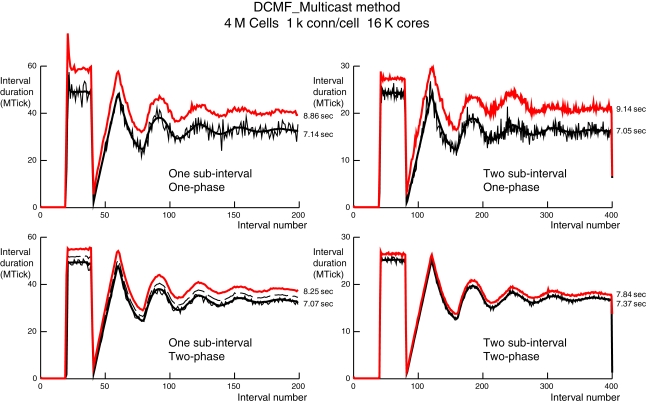
Figure 6.
Comparison of per interval performance of the DCMF_Multicast method using one (top) and two (bottom) phase spike exchange, and one (left) and two (right) sub-intervals for each maximum integration interval. For one sub-interval the number of intervals for a 200 ms simulation is 200 and for two sub-intervals the number is 400. Note that the ordinate scale is half for the two sub-interval simulations and reflects the roughly half amount of time required needed by each (sub)interval. Each simulation is for 4 M cells with 1 k ±50 connections per cell on 16 K processors. The red lines are the total time per interval. The thin black lines are the computation time per interval for the rank 0 processor. The thick black lines are the average computation time for all ranks. The dashed black lines, visible only in the one interval, two-phase simulation is the maximum computation time for all ranks. Dashed black lines in the other three simulations are overlaid by the red lines. Black lines include all spike handling time during an interval. The difference between red and black lines is the MPI_Barrier time for synchronization of all ranks along with the conservation loop involving MPI_Allreduce and residual spike handling. Total computation and simulation time for rank 0 is indicated just to the right of each red and thin black line.

