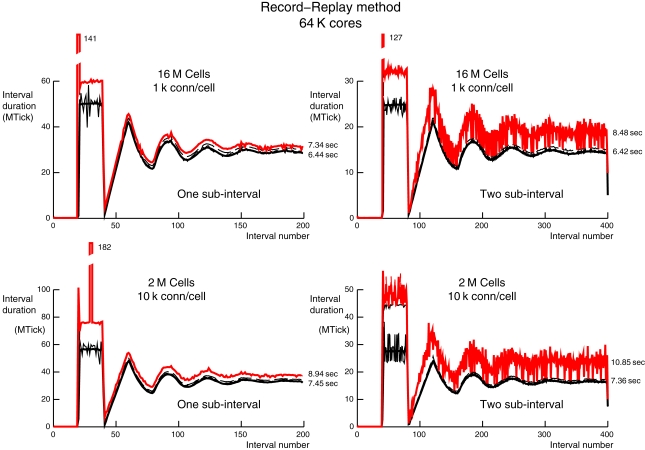
Figure 8.
Record-Replay per interval performance for 1 k (top) and 10 k (bottom) connections per cell on 64 K processors (16 M and 2 M cells on top and bottom, respectively). The style for the top and bottom are the same as the one-phase simulations (top) of Figures 6 and 7, respectively. The three large intervals that do not fit on the graph are labeled with their interval times in MTicks.

