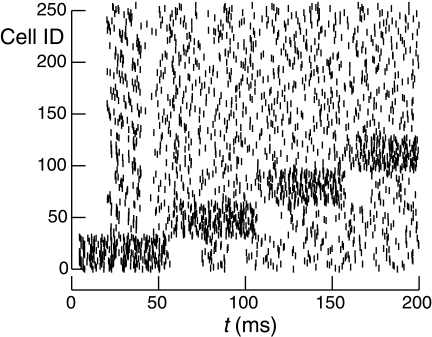
Figure 9.
Raster plot of 256 cells with 32 contiguous cell group size. Cells normally spike randomly with the uniform distribution from 20 to 40 ms. However, each group successively increases its spiking rate by a factor of 5 for 50 ms. Note that the seeming group dead time when the group returns to its normal firing rate where each cell has minimum interval of 20 ms since its last firing. cf. Figure 3.

