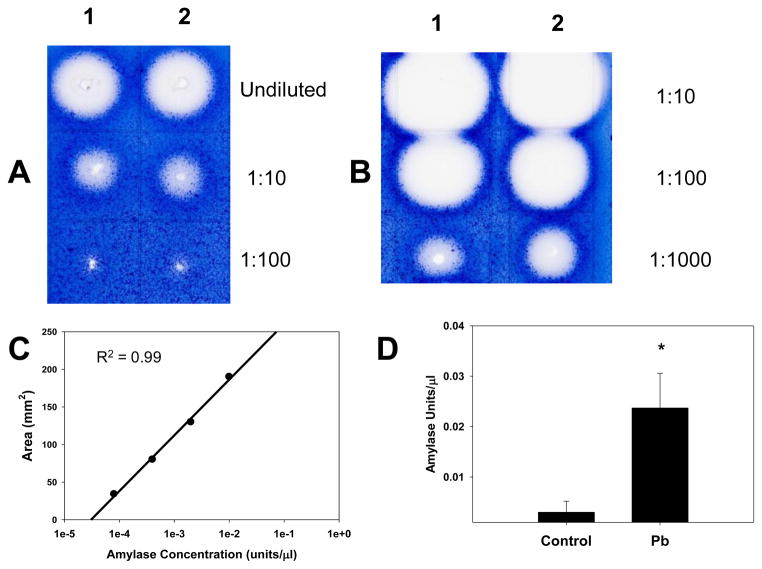
Figure 3.
Splenic amylase activity was increased by developmental Pb-exposure. Mouse pups were exposed to 0.1mM Pb from gd8 to pnd21. Spleen homogenates shown (2 control and 2 Pb-exposed) were prepared and assayed for amylase activity as described in the methods. Each spleen homogenate result shown here was from one spleen of a mouse representative of one litter. The gel photographs display the raw data, A) Control and B) Pb-exposed. Homogenates were diluted 1:10, 1:100, and 1:1000 with 0.1M phosphate buffer (pH 6.9) before applying to the gel. C shows a sample standard curve generated with purified amylase, and D shows the relative splenic amylase activity of control and 0.1 mM Pb-exposed mouse pups. Significance of the difference between the groups, indicated by the asterisk was determined by the Student’s t-test at p ≤ 0.05.

