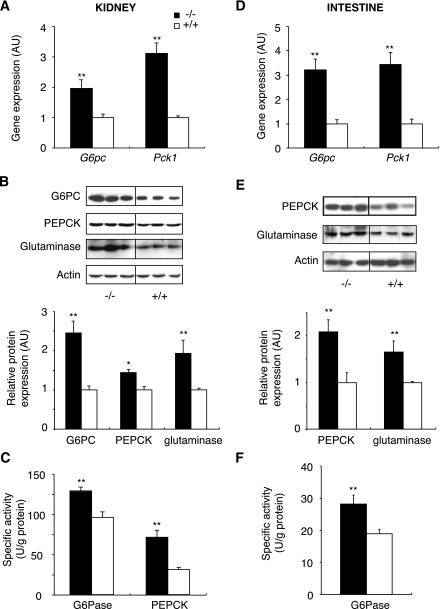
FIG. 3.
Expression of main gluconeogenic enzymes in the kidneys (A–C) and the intestine (D–F) of 6 h–fasted L-G6pc−/− mice. A and D: Level of G6pc and Pck1 mRNA expressed as a ratio relative to Rpl19 mRNA level. B and E: Western blot analysis and quantification for G6PC, PEPCK-C, and glutaminase proteins. Actin is shown as a loading control. Results are expressed as fold induction versus WT. C and D: Specific G6Pase and PEPCK-c activity of homozygous L-G6pc−/− (black bar) and WT (white bar) mice. Data were obtained 5 weeks after gene deletion, in mice fasted for 6 h (n = 6 mice per group), and are expressed as means ± SEM. Values significantly different from WT (*P < 0.05, **P < 0.01) are indicated.

