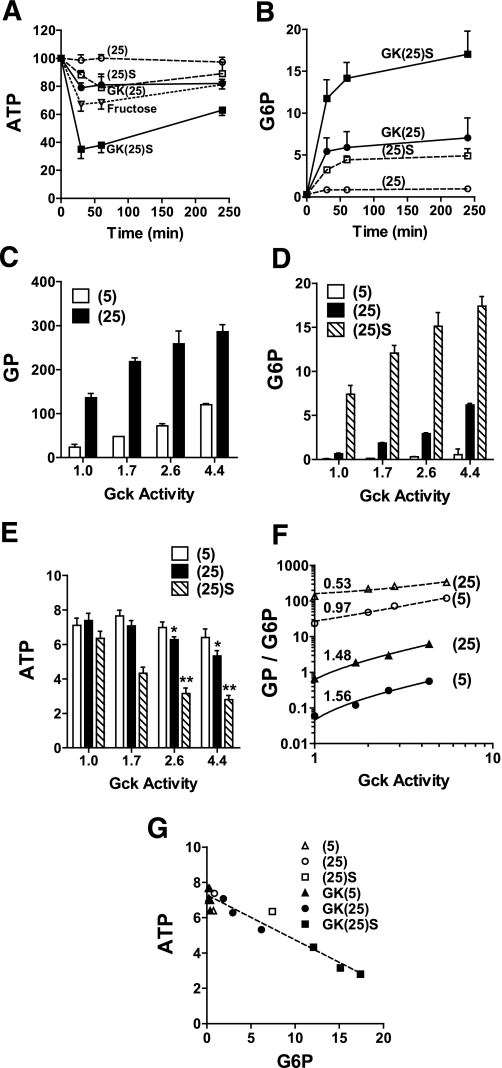
FIG. 7.
Overexpression of Gck compromises hepatocyte glucose 6-P and ATP homeostasis. Hepatocytes were untreated or treated with three titres of adenoviral vector for expression of Gck (by 1.7–4.4 fold relative to endogenous Gck activity) and cultured for 18 h in MEM containing 5 mmol/L glucose as described in research design and methods. A and B: Time course of hepatocyte ATP and glucose 6-P in untreated hepatocytes (open symbols) or cells with fourfold Gck overexpression (filled symbols) incubated in MEM containing 25 mmol/L glucose without (25) or with 2 μmol/L S4048 [(25)S] or with 5 mmol/L fructose (open triangle). C–E: Rates of glucose phosphorylation (metabolism of [2-3H]glucose) and cell glucose 6-P and ATP determined after 60-min incubation with 5 mmol/L or 25 mmol/L glucose without or with 2 μmol/L S4048, in hepatocytes expressing endogenous Gck (1) or 1.7–4.4 Gck overexpression. Means ± SEM, n = 4. *P < 0.05; **P < 0.005 relative to corresponding ATP values at endogenous Gck activity. F: Double log plot of glucose phosphorylation (open symbols) or glucose 6-P (filled symbols) vs. corresponding Gck activity (data from C and D). G: ATP vs. glucose 6-P (data from D and E).

