
Figure 4.
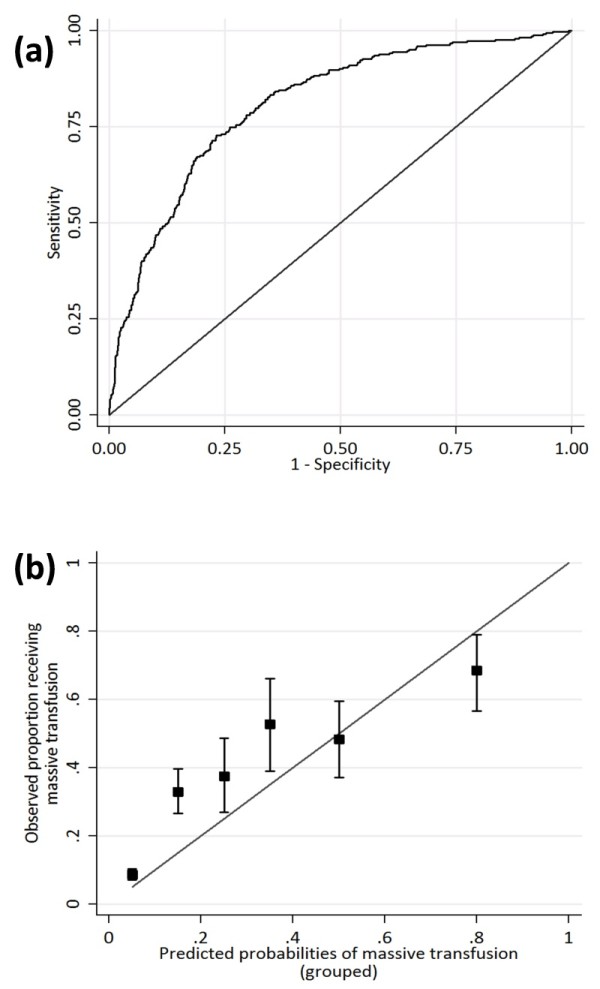
Performance of the massive-transfusion prediction tool. The performance of the model developed on non-German TR-DGU centers and validated on German TR-DGU registry data (see text). (a) Receiver operating characteristic plot. Area under the ROC curve, 0.81. (b) Calibration plot.