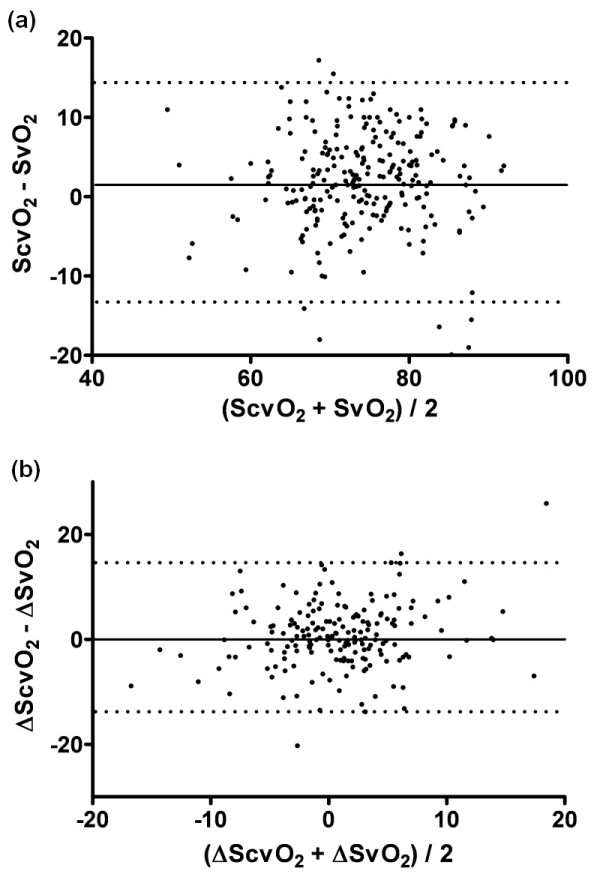
Figure 1.

Bland and Altman plot showing the agreement between (a) ScvO2 and SvO2 (bias 1.7, 95% limits of agreement from -12.1 to 15.5) and in (b) changes in ScvO2 and SvO2 (bias 0.6, 95% limits of agreement from -13.4 to 14.6). ScvO2, central venous saturation; SvO2, mixed venous saturation.
