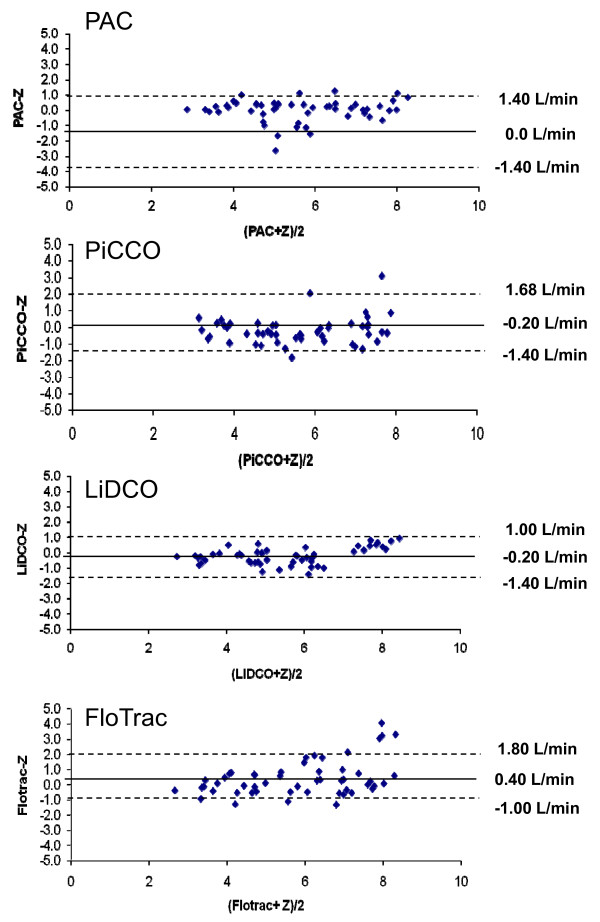
Figure 3.
Bland-Altman analysis of each device against the mean of all devices across all patients, wherein pulmonary arterial catheter (PAC) thermodilution CO (COtd) and continuous CO (CCO) are pooled to be one variable (Z-statistic). Solid line, mean difference (bias); dotted line, limits of agreement (bias ± 1.96 SD).

