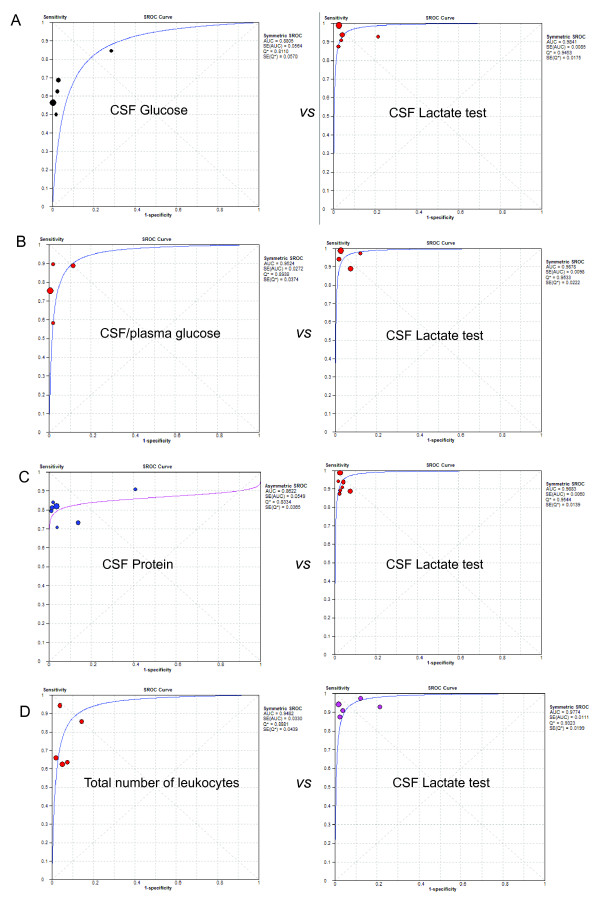
Figure 5.
SROC curve of the head to head comparison of the CSF lactate concentration and other conventional markers. Each circle indicates an individual study in the meta-analysis. The curve is the regression that summarizes the overall diagnostic accuracy. SE(AUC), standard error of AUC; SE(Q*), standard error of Q* value. The size of the circle represents the study size.

