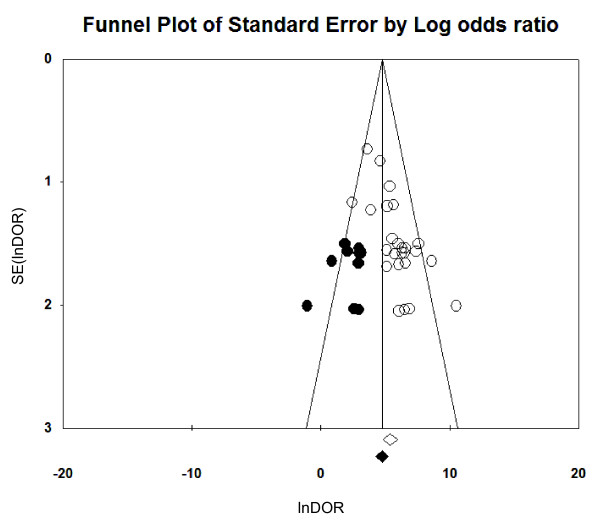
Figure 6.
Funnel plots for evaluation of publication bias in the 25 included studies. The funnel graph plots the standard error of the lnDOR (SE(lnDOR)) against the log of the diagnostic odds ratio (lnDOR). Each empty circle represents one observed study in the meta-analysis, while an empty diamond indicates the original pooled lnDOR and its 95% confidence interval. The Trim and Fill method was used to find unpublished studies (filled circles) and compute the true vertical line center of the funnel and the adjusted pooled lnDOR (filled diamond) after adding in missing studies (depicted with black dots).

