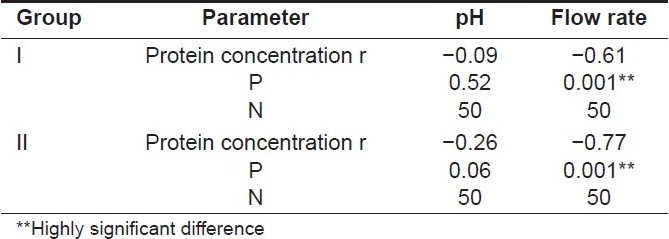
Table 4.
Inter-group correlation between the mean salivary pH, flow rate, and protein concentration (using Pearson's correlation coefficient test)

Inter-group correlation between the mean salivary pH, flow rate, and protein concentration (using Pearson's correlation coefficient test)
