
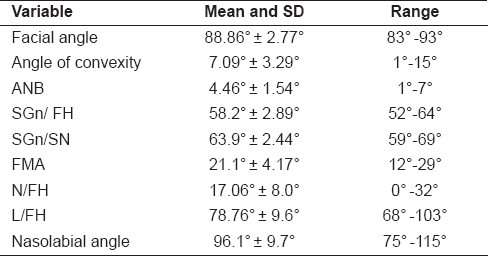
Table 2.
The mean and standard deviation and range for all of the angular measurements in degree based on the 45 samples from the Indian population
Official websites use .gov
A
.gov website belongs to an official
government organization in the United States.
Secure .gov websites use HTTPS
A lock (
) or https:// means you've safely
connected to the .gov website. Share sensitive
information only on official, secure websites.
The mean and standard deviation and range for all of the angular measurements in degree based on the 45 samples from the Indian population