. 2010 Jul-Sep;1(3):158–163. doi: 10.4103/0976-237X.72783
Copyright: © Contemporary Clinical Dentistry
This is an open-access article distributed under the terms of the Creative Commons Attribution-Noncommercial-Share Alike 3.0 Unported, which permits unrestricted use, distribution, and reproduction in any medium, provided the original work is properly cited.
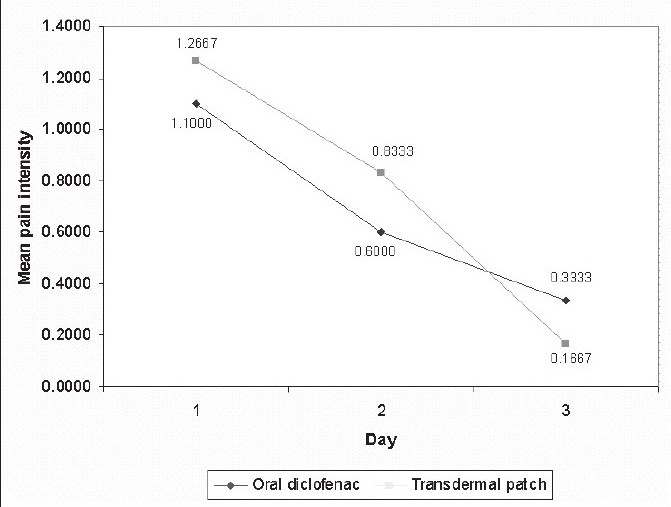
Graph 1.

variation in the mean intesity from day 1 to day 3
