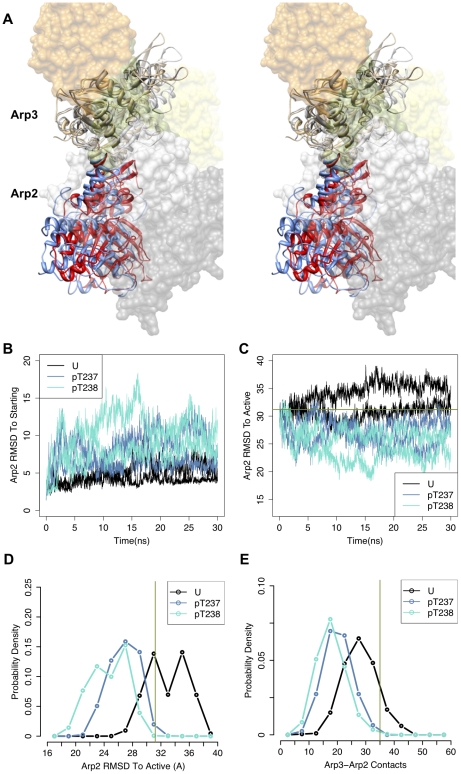
Figure 3. Changes in Arp2-Arp3 orientation upon phosphorylation.
(a) Arp3 and Arp2 subunits from snapshots from the last ns of the unphosphorylated (Arp3-gray; Arp2-blue) and phosphorylated T237 Arp2 (tan, red) wild-type simulations are shown following alignment of Cα atoms of subdomains 1 and 2 of Arp3. These and all other structural figures were produced using the molecular graphics program UCSF Chimera [56], except where indicated. The other subunits of the complex from the snapshot of the unphosphorylated simulation, colored as in Fig. 2a, were represented as transparent surfaces in order not to occlude the views of Arp2 and Arp3. (b) RMSD of Arp2 Cα atoms to their initial positions vs. simulation time following alignment of subdomains 1 and 2 of Arp3. (c) RMSD of Arp2 Cα atoms to their positions in the model of the active short-pitch dimer orientation (B. Nolen, personal communication) vs. simulation time following alignment of subdomains 1 and 2 of Arp3. (d) Distribution of root-mean-square deviations (RMSD) of Cα atoms of Arp2 from the MD trajectory to Arp2 atoms in the active short-pitch dimer orientation after alignment of subdomains 1 and 2 of Arp3 over the last 20 ns of simulations. (e) Distribution of number of contacts between Arp3 and Arp2 heavy atoms over the last 20 ns of simulations. In (b)–(e), coloring is as follows: U(black)- unphosphorylated; pT237(blue-gray) – phosphorylated T237 Arp2; pT238(cyan) – phosphorylated T238 Arp2. RMSD of Arp2 Cα atoms in the initial model to their positions in the active orientation is 31.2 Å, and the number of Arp3-Arp2 contacts in the initial model is 35. These values are indicated for reference in the appropriate plots with a green line.

