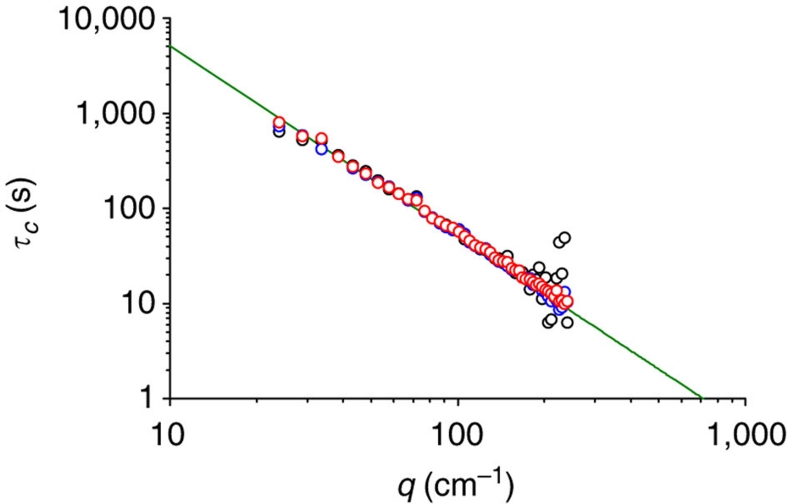
Figure 3. Relaxation time of non-equilibrium concentration fluctuations as a function of wave vector.
The black data correspond to a temperature difference of 4.35 K, the blue data to 8.70 K and the red ones to 17.40 K. The solid line represents the diffusive time τc(q)=1/(Dq2) as estimated from literature data for the diffusion coefficient.

