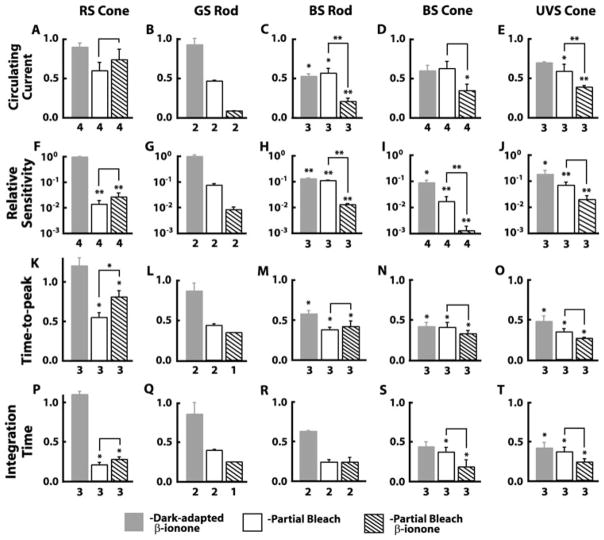
Fig. 2.
Comparison of β-ionone effects on dark-adapted and partially bleached salamander rods and cones. Responses under different experimental conditions were normalized to the dark-adapted untreated values. Dark-adapted cells were exposed to β-ionone (gray bars) (12.8 ± 0.3 μM; 6–19-min duration), returned to Ringer’s solution and partially bleached (open bars), and exposed to β-ionone again (hatched bars). (A–E) Circulating current, given by rmax, the saturating response amplitude under each condition, was suppressed in BS rods and cones and UVS cones in the presence of β-ionone (C–E) but not in RS cones (A) or GS rods (B). (F–J) RS cones and GS rods exhibited no change in relative sensitivity (F and G), while all other photoreceptor types showed a decrease on exposure to β-ionone (H–J). Relative sensitivity varies as the reciprocal of i0.5, the flash strength at kmax giving rise to a half-maximal response, so relative sensitivity was expressed as i0.5dark/i0.5treated. (K–T) Dim flash response kinetics of BS rods, BS cones, and UVS cones were accelerated by β-ionone. Flashes giving rise to responses whose amplitudes were <0.15 rmax were considered to be dim. Time to peak was taken as the interval from midflash to the peak of the dim flash response and integration time as the response integral divided by response amplitude. Changes in normalized circulating current and sensitivity to flashes were compared with analysis of variance (ANOVA) and post hoc Bonferroni analyses using log values to minimize skewness introduced by the use of ratios. Changes in dim flash response time to peak and integration time were compared with a one-way ANOVA followed by a post hoc Tukey–Kramer analysis using raw data but were plotted as ratios for standardization across cell types. Values for dark-adapted β-ionone, partial bleach, and β-ionone after partial bleach were compared to dark adapted/untreated, with additional comparisons between values for partial bleach and β-ionone after partial bleach (lines over bars): *P < 0.05; **P < 0.01. Comparisons were not made for data sets where n = 2 or lower. Error bars represent SEM, and numbers of observations are listed beneath the bars. SEM, standard error of mean.

