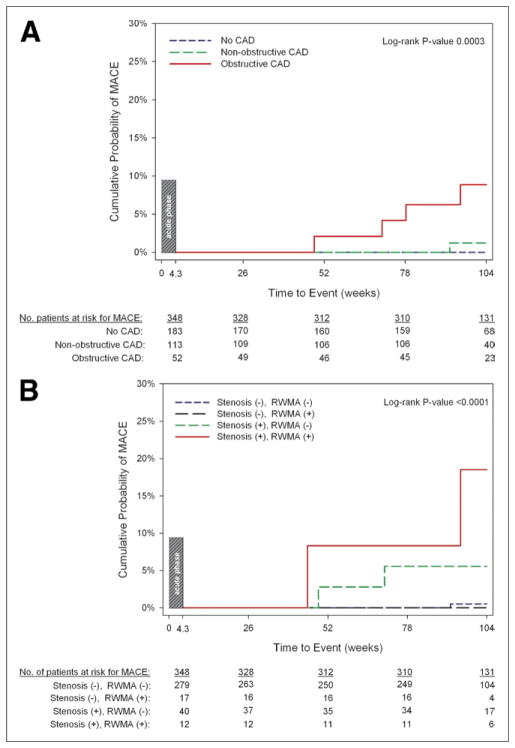
Figure 3. Kaplan-Meier Curves of Late (>30 Days) MACE as Stratified by Cardiac CT Features.
(A) Coronary artery disease (CAD) categories stratified into no CAD, nonobstructive CAD, and obstructive CAD. (B) Coronary and functional computed tomography (CT) categories stratified into no stenosis or regional wall motion abnormalities (RWMA), no stenosis with RWMA, stenosis without RWMA, and stenosis with RWMA.

