Figure 2.
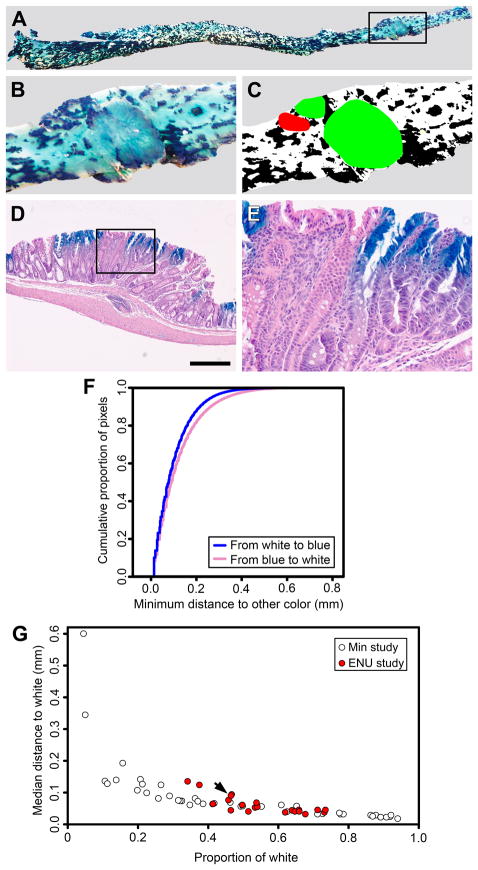
Some intestinal tumors from ENU-treated aggregation chimeras are overtly polyclonal. Aggregation chimeras were generated and treated as adults with ENU. The mice were sacrificed when moribund and the intestinal tract was removed and stained with X-Gal. Rosa26− cells are white, whereas Rosa26+ cells are blue. The entire colon from Chimera 101 is shown (A); the outlined area is enlarged in (B). Three tumors are evident in the wholemount at higher magnification (B) and the digitized image (C). Two tumors were overtly polyclonal (green) and one was not scorable (red). Tumor phenotype was determined by examining paraffin sections stained with hematoxylin and eosin (D); the outlined area is enlarged in (E). In this example, blue and white neoplastic cells are evident at higher magnification (E). Distance maps describing the relationship between blue and white tissue in the colon of Chimera 101 were calculated and summarized by cumulative distribution functions (F). The intestine from each aggregation chimeras was segmented into five regions. The pattern of chimerism for each region is summarized by the median of the minimum distance to the opposite color, specifically, the median of the distance-map function and compared to the proportion of the reference color (G, red circles). The arrow indicates the data for the colon of Chimera 101. Results from very small pieces adjacent to tumors that were used in our previous study involving Min mice (5) are shown for comparison (A-B, white-filled circles), and indicate that the pattern of chimerism is not substantially different between the two studies. Note that the wider distribution of samples from the earlier study along the horizontal axis is attributable to size of the very small pieces that were analyzed. Panel D scale bar = 500 μm.

