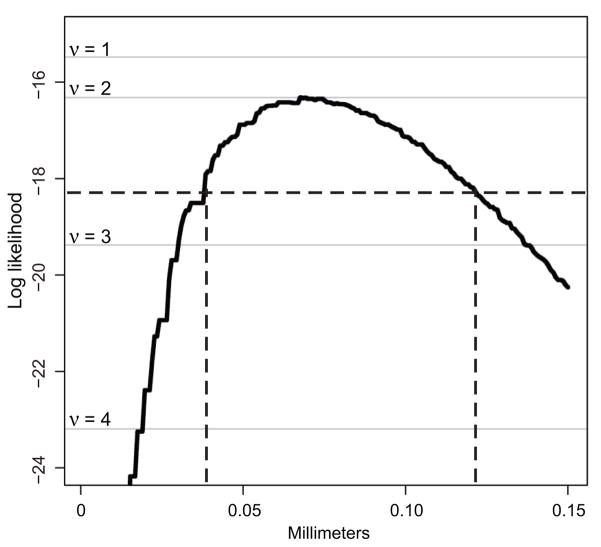
Figure 3.
Two statistical analyses were performed to analyze the pattern of chimerism and to begin to understand the nature of clonal interactions. The log likelihood function for the disk model is shown (curve). This model combines the tumor phenotype data with the image analysis to assess the extent of clonal interactions if an initiated clone can recruit neighboring clones. The maximum likelihood estimate of disk radius is 68μm with a 95% confidence interval of 38 to 121μm (dashed lines). Log likelihoods for an arbitrary-range model of polyclonality are also shown (grey lines labeled ν = 1–4), and indicate that an initiated clone together with one partner (ν=1), randomly drawn from the intestine, provides a parsimonious and well-fitting explanation of tumor phenotypes.

