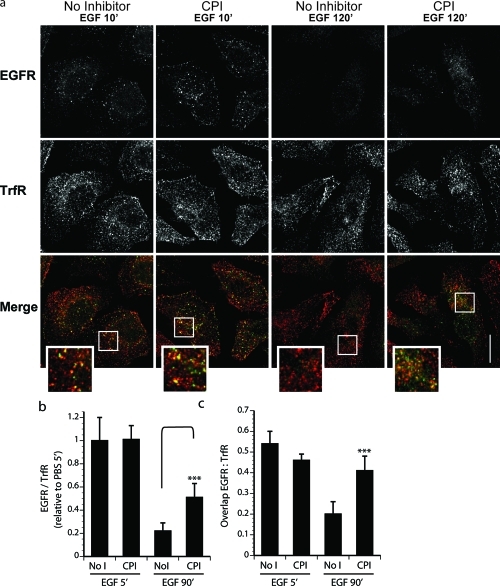
Figure 5.
Confocal images of EGFR degradation. Inhibition of endolysosomal proteases slows EGFR downregulation and alters receptor trafficking. (a) Immunofluorescence microscopy of HeLa cells preincubated in the presence or absence of CPI and stimulated with EGF as indicated. Fixed samples were immunostained against endogenous EGFR (left panels, green) and transferrin receptor (TrfR, middle panels, red) with merges of the two channels shown (right panels). Representative images taken under the same magnification and laser settings are shown with 6x inset magnification and scalebar corresponding to 10 μm. (b) Quantification of EGFR abundance expressed as a fraction of TrfR in the same cells is represented relative to no inhibitor, t = 5 min sample. (c) Quantification of colocalization between the two receptors expressed as a fraction of EGFR overlapping TrfR. Error bars for quantification correspond to SD calculated on the basis of 20–25 cells for each conditions using Student’s t test.

