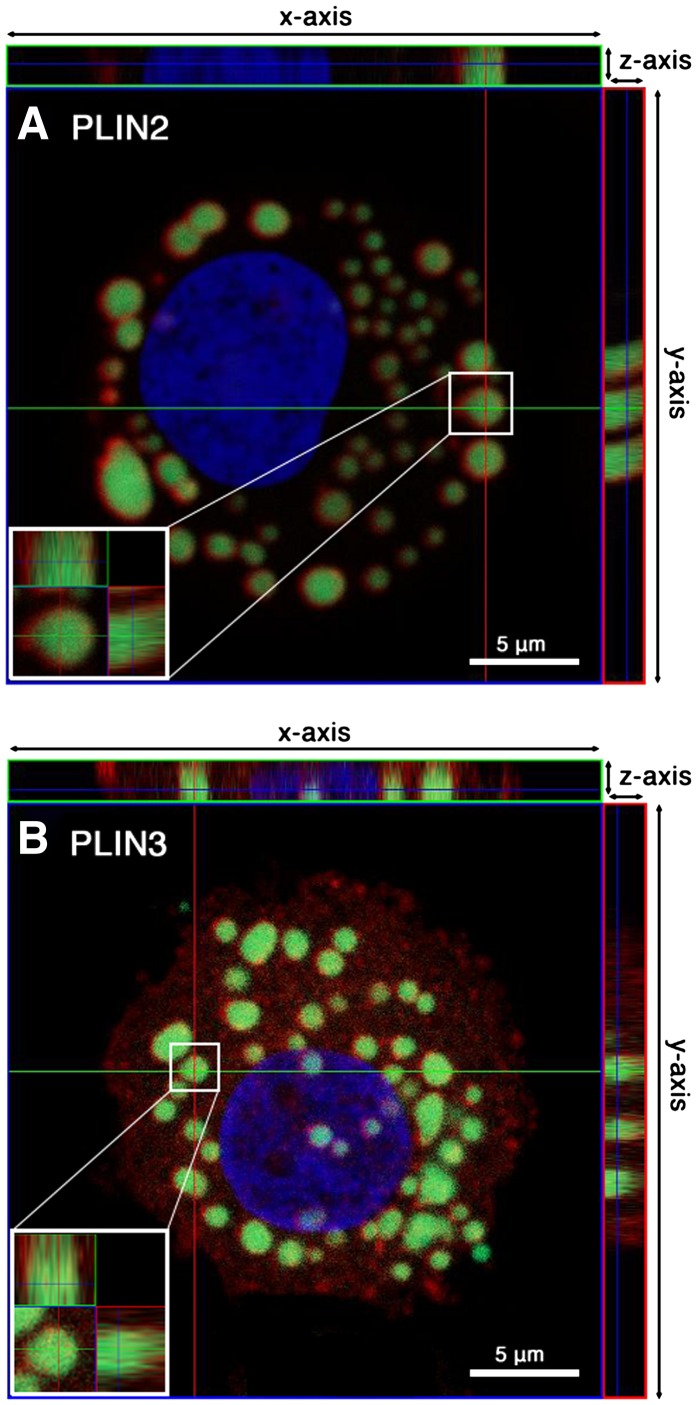
Fig. 6.
Intracellular localization of PLIN2 and PLIN3 in MCs. For the analysis of the intracellular distribution of PLIN2 (A) and PLIN3 (B), MCs were probed with mouse anti-human PLIN2 or with guinea pig anti-human PLIN3. The primary antibodies were probed with Alexa Fluor-594 goat anti-mouse IgG (A) or Alexa Fluor-594 goat anti-guinea pig IgG (B). LBs were stained with BODIPY 493/503, and nuclei were counterstained with DAPI. Orthogonal projections of confocal z-stacks of representative LBs are shown (A, B). The main images of both panels show an xy-section of a MC at the z-positions indicated by dark blue lines in the xz-plane (x-axis/z-axis; small top rectangular figure) and the yz-plane (y-axis/z-axis; small right rectangular figure). Insets (A, B) show magnified orthogonal views of the indicated single LBs.

