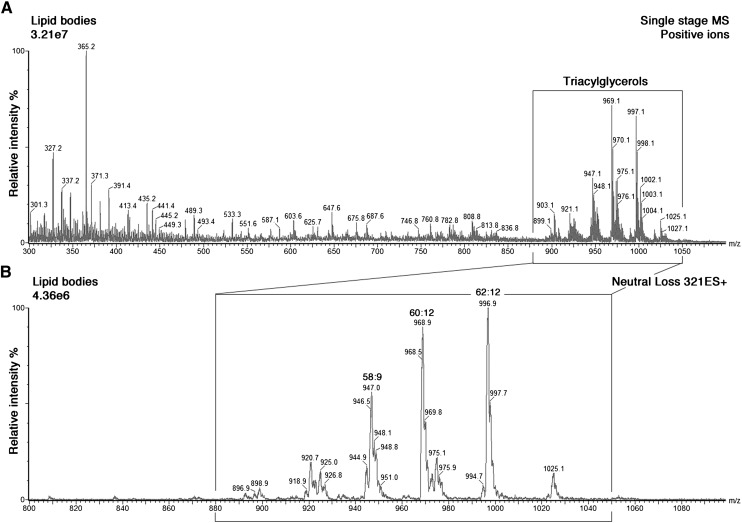
Fig. 9.
Mass spectrometric analysis of MC lipid bodies. Lipid bodies were induced in MCs by incubating the cells in the presence of arachidonic acid, as described in Fig. 8. The bodies were then isolated, and their lipids extracted and analyzed by mass spectrometry. A: Positive ESI-MS of total lipid extract of LBs. Triacylglycerols (small rectangular box) are detected between m/z 880 and 1,050. B: Arachidonic acid-containing triacylglycerols (large rectangular box) were detected by the neutral loss scan for 321 amu during ESI-MS of neutral lipids extracted from LBs. The main arachidonic-acid-containing triacylglycerol species, denoted [sum of acyl carbons]:[sum of double bonds in the chains] with their m/z values and most likely acyl chain composition in parenthesis, were 58:9 (m/z 946; 18:1-20:4-20:4), 60:12 (m/z 968; 20:4-20:4-20:4) and 62:12 (m/z 996; 20:4-20:4-22:4). The intensity scales of the spectra were normalized to the largest signal in the selected m/z range. amu, atomic mass unit.

