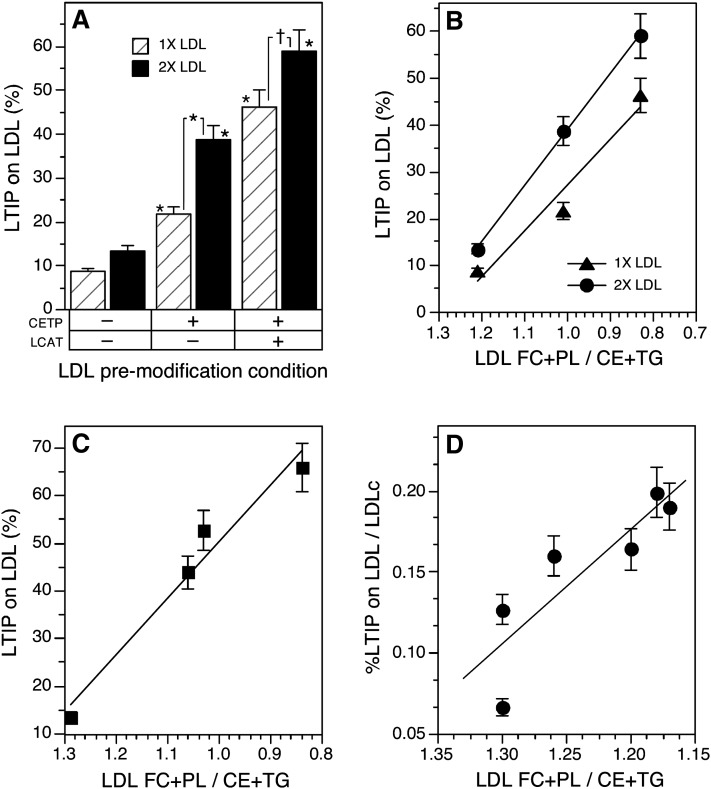
Fig. 6.
Influence of LDL composition on LTIP association with LDL. A: The d < 1.063 g/ml (VLDL+LDL) fraction of plasma was recombined with a plasma equivalent volume of d > 1.21 g/ml (lipoprotein-free fraction) of plasma ± 1 mM paraoxon and incubated at 4°C or 37°C for 22 h. Under these conditions, LDL was either unmodified (4°C), modified by CETP (37°C + paraoxon) or modified by CETP and LCAT activities (37°C, no paraoxon). LDL was isolated from these mixtures by ultracentrifugation. Native or modified LDL (160 (1×) or 320 (2×) µg protein) was then combined with native 470 kDa LTIP fraction (200 µg protein) and 500 µl of lipoprotein-free plasma (d > 1.21 fraction). All samples received anti-CETP (21 µg) and 1 mM paraoxon so that CETP and LCAT were inactive during this phase of the experiment. Samples were incubated at 37°C for 6 h. † P < 0.05, * P < 0.01 compared with unmodified LDL or as indicated. B: The percent LTIP on LDL measured in A is plotted versus the ratio of free cholesterol (FC) + phospholipid (PL) divided by cholesteryl ester (CE) + triglyceride (TG) in LDL. The reverse x axis places native LDL on the left side of the graph. Correlation coefficients for both regression lines are ≥ 0.98. C: The percent LTIP on LDL after incubation of whole plasma as described in Table 3 is plotted versus the FC + PL-to-CE + TG ratio of the LDL isolated from those incubations. Correlation coefficient for the regression line is 0.99, P = 0.02. Data are representative of three similar experiments. D: The percent LTIP on LDL in normolipidemic subjects and those with borderline high cholesterol or TG is plotted versus LDL composition. Values on the y axis have been normalized by dividing the %LTIP on LDL by the LDL cholesterol (LDLc) content of each sample. Correlation coefficient for the regression line is 0.87, P = 0.025. Of the seven plasma samples analyzed, six are plotted here. The remaining sample, perhaps due to its very low HDL and LTIP content, did not fit this correlation.

