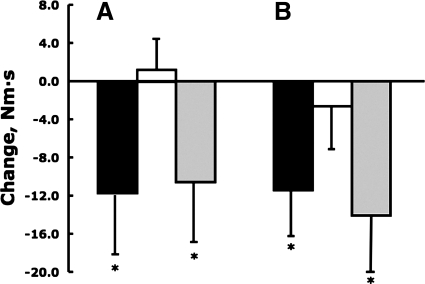
Fig. 3.
Changes in angular impulse in the knee in the frontal plane (A) and in the ankle in the sagittal plane (B) measured at self-selected gait speed between baseline and follow-up 1 (black), between follow-ups 1 and 2 (white), and between baseline and follow-up 2 (gray). Vertical bars indicate ±1 SD. *P < 0.05.

