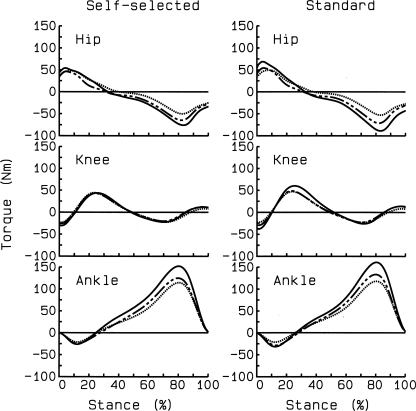
Fig. 4.
Mean joint torque curves at baseline (solid line), follow-up 1 (dashed line), and follow-up 2 (dotted line) for self-selected and standard speeds. Positive values are internal extensor torques. Despite massive weight loss, extensor angular impulses at hip and knee joints remained statistically unchanged whereas there were significant reductions in ankle plantarflexor angular impulse from baseline to follow-up 1.

