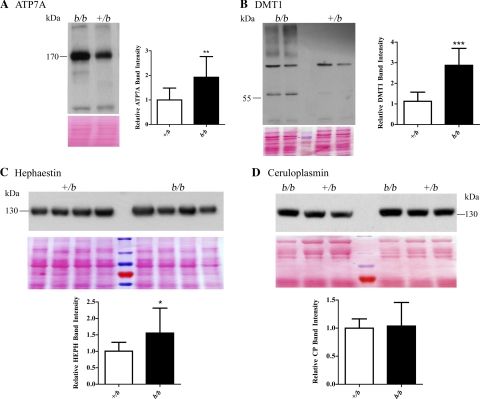
Fig. 4.
Western blot analysis of iron/copper-related proteins. In each panel, a representative Western blot is shown along with quantitative data from all rats studied. Numbers beside the Western blots indicate the placement of the closest molecular weight marker. Band intensities were normalized vs. total protein on the stained blots (shown below each lane of the Western blots). In A, B and C, membrane proteins extracted from enterocytes were reacted with antibodies against the respective proteins. A: anti-ATP7A antibody (+/b, n = 12 and b/b, n = 7). B: anti-DMT1 antibody (+/b, n = 10 and b/b, n = 6). The band just above 55 kDa was quantified (See discussion for explanation). C: anti-HEPH antibody (+/b, n = 15 and b/b, n = 8). D: serum proteins were reacted with anti-Cp antibody (+/b, n = 13 and b/b, n = 7). *P < 0.05, **P < 0.01, ***P < 0.001; all indicating significant differences between genotypes. Means ± SD are shown.

