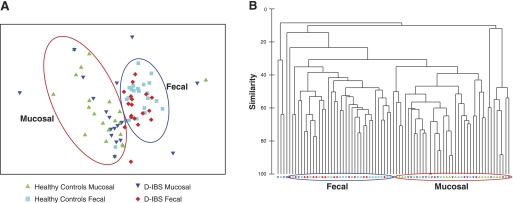
Fig. 3.
A: nonmultidimensional scaling analysis of T-RF profiles generated from fecal and mucosal samples from D-IBS patients and healthy controls. B: hierarchical cluster analysis of T-RF data from fecal and mucosal samples from D-IBS patients and healthy controls. Red and blue circles represent the majority of mucosal and fecal samples, respectively.

