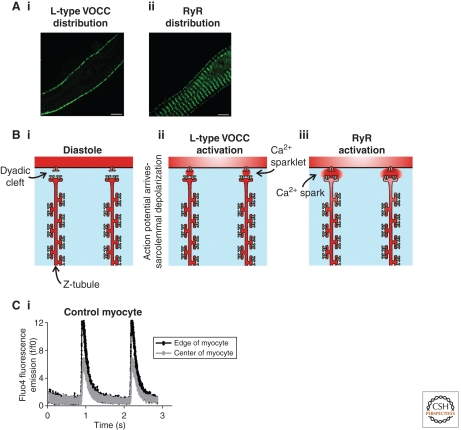
Figure 2.
Excitation contraction coupling in atrial myocytes. Panel A illustrates the distribution of L-type VOCCs (Ai) and type 2 RyRs (Aii) in a section of an atrial myocyte. The pattern of L-type VOCC expression is clearly different from that in ventricular cells. The distribution of RyRs is similar to that in ventricular cells, except that there is an evident population of peripheral RyRs around the edge of the myocyte. Solely these peripheral RyRs align with the L-type VOCCs to produce functional dyads. Panel B is a cartoon sequence of events leading to the generation of a Ca2+ signal within an atrial myocyte. A small section of an atrial myocyte is depicted. There are no T-tubules, but instead two prominent SR tubules with a spacing of ∼1.8 µm. Such SR tubules have previously denoted as “Z-tubules,” as they occupy the Z-line (just like T-tubules). During the diastolic phase (Bi), the L-type VOCCs (red channels on the T-tubule membranes) and RyRs (blue channels on SR membrane) are silent. Arrival of the action potential causes depolarization of the sarcolemma and activation of the L-type VOCCs thereby generating “Ca2+ sparklets” at the periphery of the cell (Bii). The Ca2+ sparklets trigger activation of nearby RyRs thereby producing “Ca2+ sparks” (Biii). Panel Ci depicts the gradient of Ca2+ typically observed during electrical pacing of atrial myocytes. The Ca2+ signal at the edge of the cell (black trace) is larger and more rapidly rising than the central response (gray trace). The extent to which the Ca2+ signal occurs in the center of the cell (and thereby causes contraction) is dependent on the inotropic status of the cell. Application of a β-adrenergic agonist can make atrial Ca2+ signals become homogenous.

