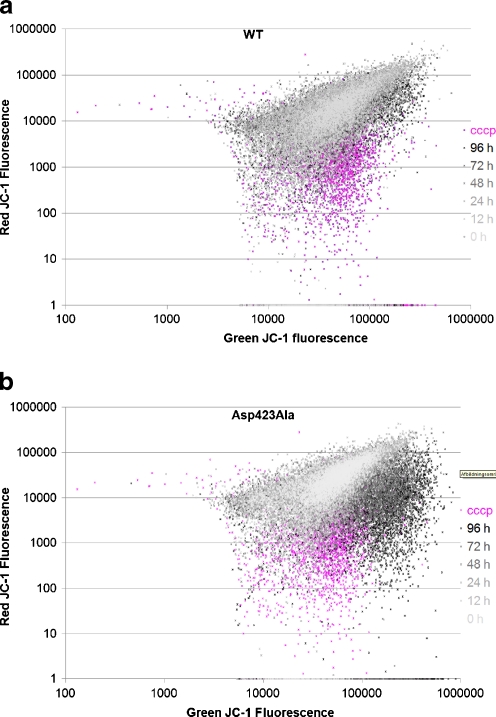
Fig. 5.
The mitochondrial membrane potential was monitored by measuring the red JC-1 fluorescence relative to the green JC-1 fluorescence as described in “Materials and methods” section. wt cells (a) and Asp423Ala cells (b) were induced with tetracycline, harvested and analyzed with the NucleoCounter N3000 after 0, 12, 24, 48, 72, and 96 h, respectively. Addition of CCCP resulting in disruption of the membrane potential was included as a control (pink). Each dot represents the red/green fluorescence ratio from a single cell

