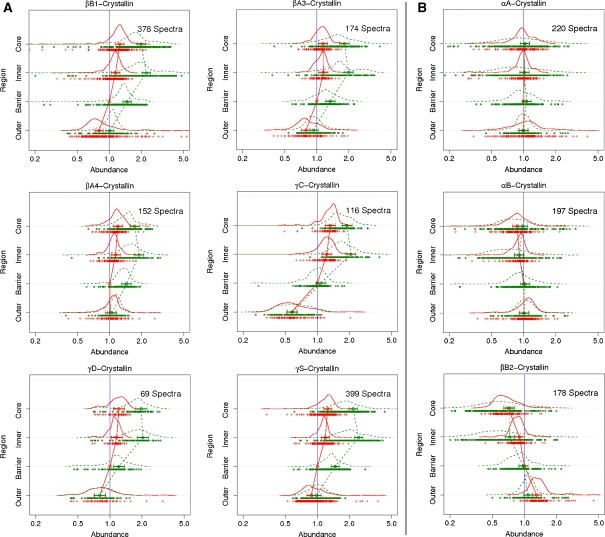
Fig. 3.
A Membrane-bound proteins that increase with age. B Membrane-bound proteins that showed little or no significant change with age. 8-plex iTRAQ analysis was used to generate the data sets. Four geometric regions were dissected from two lenses aged 20 and 52. These regions are denoted as the core, inner, barrier and outer. The 8-plex results were normalised for each protein to the value of the young lens barrier region to allow direct comparison with the 4-plex data. Each curve green (old lens) and red (young lens) represents the frequency of peptides at given expression fold changes from that protein. The dots represent individual data points. The circles represent the average change in abundance for that particular region, with horizontal lines representing credible intervals

