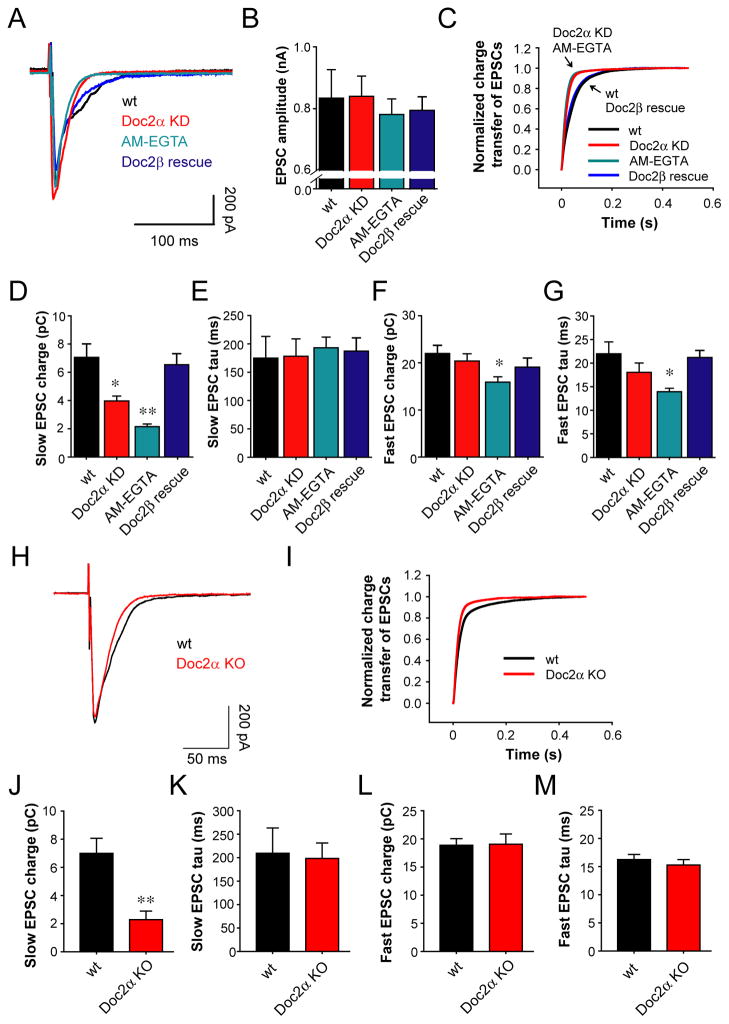
Figure 5.
Doc2α KD specifically reduces the asynchronous phase of SV release in wt hippocampal neurons. (A) Average traces of evoked EPSCs recorded from wt neurons and neurons pre-incubated with 25 μM AM-EGTA, as well as neurons expressing Doc2α shRNA alone or accompanied by expression of Doc2β. (B) Bar graphs summarizing the amplitude of EPSCs recorded from wt neurons (n = 29), neurons treated with AM-EGTA (n = 67), and neurons expressing Doc2α shRNA alone (n = 42) or Doc2α shRNA plus Doc2β (n = 25). (C) Average normalized cumulative EPSC charge transfer over 0.5 s demonstrating that neurons treated with AM-EGTA, or expressing Doc2α shRNA alone, significantly accelerate the decay kinetics of EPSCs, as compared to wt neurons and Doc2α KD neurons expressing Doc2β. (D and E) Bar graphs summarizing the charge (D) and the time constant (E) of the slow phase of transmission. (F and G) Bar graphs summarizing the charge (F) and the time constant (G) of the fast phase of transmission. (H) Average traces of evoked EPSCs recorded from wt neurons (n = 18) and Doc2α KO hippocampal neurons (n = 23). (I) Average normalized cumulative EPSC charge transfer over 0.5 s from wt neurons and Doc2α KO neurons. (J and K) Bar graphs comparing the charge (J) and the time constant (K) of the slow phase of transmission between wt neurons (n = 18) and Doc2α KO neurons (n = 23). (L and M) Bar graphs summarizing the charge (L) and the time constant (M) of the fast phase of transmission. * p<0.05, ** p<0.001. Error bars represent SEM.

