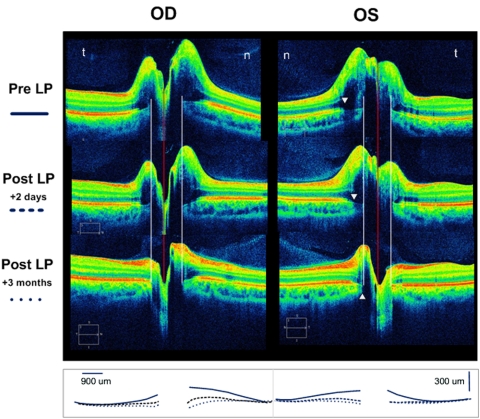
Figure 6.
The SD-OCT 5-line raster (3:2 aspect ratio) of a 22-year-old man with idiopathic intracranial hypertension (opening pressure, 48 cm) before and after spinal tap and then after 3 months of treatment. Sequential superimposed line tracings of the RPE/BM layer from each raster is summarized in the bottom row. The pre-LP SD-OCT shows massive disc elevation in both eyes with anterior displacement of the RPE/BM layer toward the vitreous. Two days later, after the LP, the shape of the RPE/BM becomes flatter and posteriorly displaced OU. There was a corresponding decrease in the RNFL over this time interval (OD, 351 to 283 to 122 μm; OS, 279 to 234 to 112 μm) The RPE/BM bordering the NCO was displaced by at least 150 to 250 μm. White arrowheads: the beginning of the penumbra caused by the overlying disc elevation. Although the signal from the margin of the RPE/BM and choroid is diminished, it is still possible to locate the border of the NCO (white lines). The NCO diameter is the distance between the two white lines. n, nasal; t, temporal; LP, lumbar puncture.

