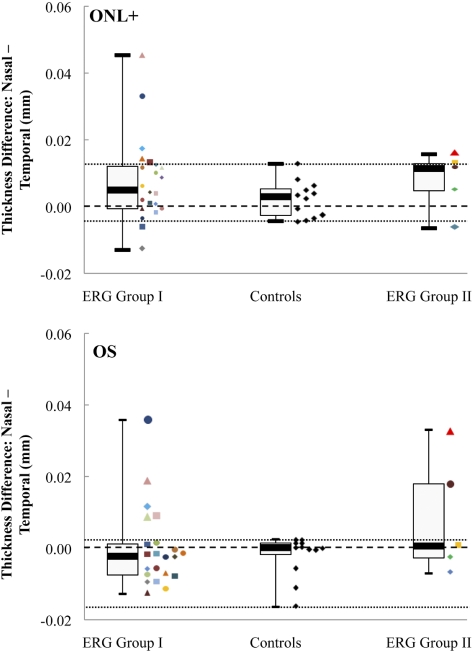
Figure 7.
Box-and-whisker plots of the ONL+ and OS layer mean thicknesses differences between the nasal and temporal macula, at eccentricities from 9° to 12°, in the controls and in both ERG groups. The median values of each subgroup are presented together, with the first and third quartiles and the minimum and maximum values. Colored symbols: individual patient mean thickness differences values at these eccentricities. Central black dashed line: 0 difference; top and bottom dashed lines: the highest and lowest differences detected between the nasal and temporal macula, respectively, in the controls.

