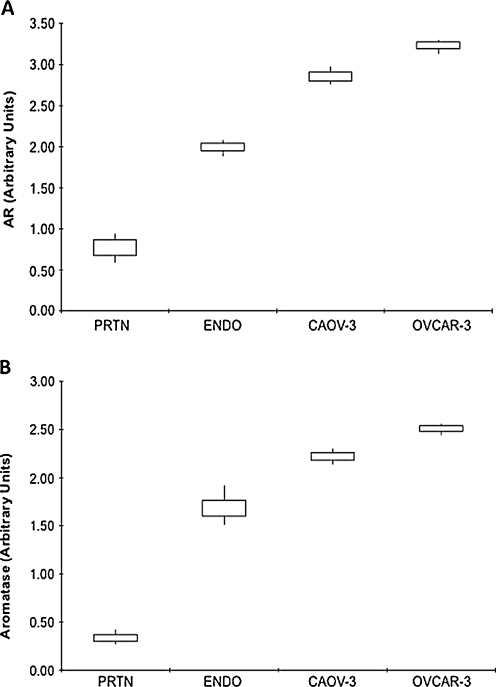
Fig. 3.
Androgen (AR) and aromatase gene expression in different tissues and cells. mRNA levels, as determined by real-time RT-PCR, in normal peritoneum (PRTN) (n = 7), ovarian endometriotis (ENDO) (n = 7) and EOC cells Caov-3 (n = 3) and OVCAR-3 (n = 3). Data are expressed as interquartile ranges and are presented as box plots, in which the boxes represent the first and third quartiles, and the lines outside the box represent the spread of values. *P < 0.001, P values indicate the comparison to normal peritoneum

