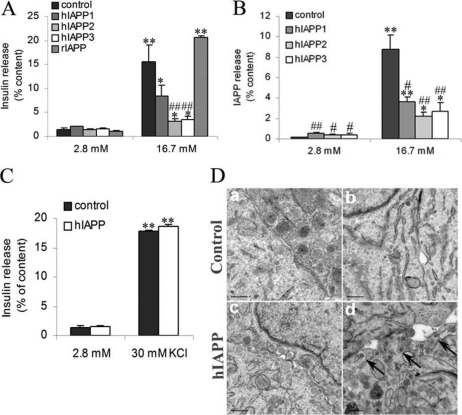
FIGURE 2.
Secretory capacity in response to glucose in stable INS1E clones. A and B, 2 h before analyses, cells were depleted without glucose, after which insulin and IAPP release was measured following 1.5 h of incubation at basal 2.8 mm glucose and stimulatory 16.7 mm glucose. C, insulin secretion was also measured in the presence of 30 mm KCl. Insulin (A and C) and IAPP (B) secretion was tested in stable INS1E clones. Values were normalized to total cellular content of insulin and IAPP, respectively.*, p < 0.05; **, p < 0.01 versus secretion at 2.8 mm glucose; #, p < 0.05; ##, p < 0.01 versus corresponding control (n = 5). Results are expressed as mean ± S.E. D, electronic microscopy images from control and hIAPP cells. After 2 h of 2.8 mm glucose stimulation, secretory vesicles are detected in both clones (panels a and c). After 2 h of 16.7 mm glucose stimulation, secretory vesicles are not detected in control cells (panel b) but seem to be accumulated at the plasma membrane in hIAPP cells (arrows in panel d). Bars are 0.2 μm.

