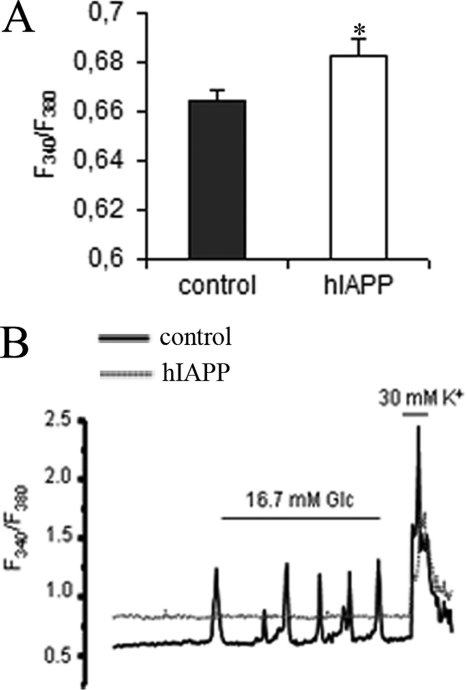
FIGURE 5.
Intracellular Ca2+ signals clones in response to glucose in stable INS1E. Cells were cultured overnight at 2.8 mm glucose before analyses. Intracellular Ca2+ levels were detected with fura 2-AM fluorescent probe. A, basal intracellular Ca2+ concentrations were measured at basal 2.8 mm glucose. *, p < 0.05 versus control cells (n = 192–201). Results are expressed as mean ± S.E. B, representative diagram of measurement of intracellular calcium in response to the addition of 16.7 mm glucose and 30 mm KCl. Fluorescence changes are expressed as the ratio of fluorescence at 340 and 380 nm (F340/F380).

