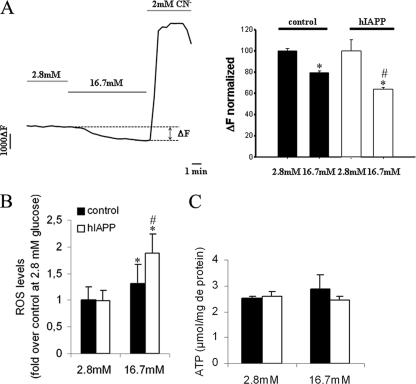
FIGURE 7.
Δψm, ROS, and ATP levels in stable INS1E clones. Cells were cultured overnight at 2.8 mm glucose before analyses. A, Δψm was monitored as rhodamine-123 fluorescence, and hyperpolarization was induced by raising glucose from basal 2.8 mm to stimulatory 16.7 mm. Complete depolarization of the mitochondrial membrane was induced by the addition of 2 mm of the mitochondrial toxicant cyanide (CN−). *, p < 0.05 versus Δψm at 2.8 mm glucose; #, p < 0.05 versus corresponding control cells (n = 139–150). B, ROS levels were measured following a 2-h incubation at 16.7 mm glucose using CM-H2DCFDA fluorescent probe. *, p < 0.05 versus ROS level at 2.8 mm glucose; #, p < 0.05 versus corresponding control cells (n = 6). C, ATP levels were measured following a 30-min incubation at 16.7 mm glucose using a luciferin-luciferase bioluminescent assay (n = 3–5). Results are expressed as mean ± S.E.

