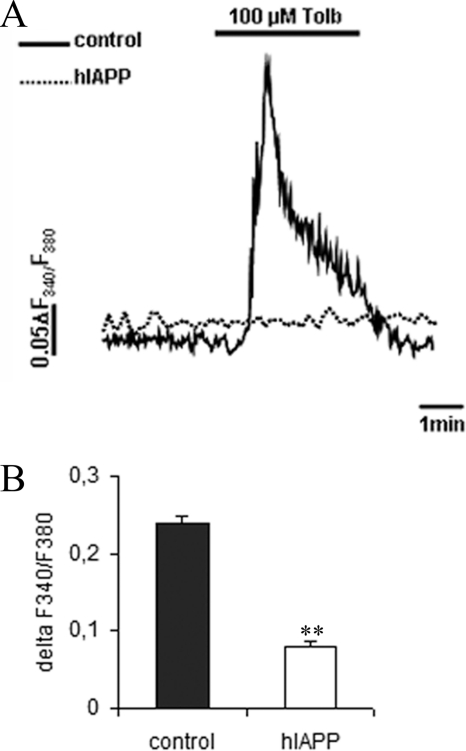
FIGURE 8.
Intracellular Ca2+ signals in response to sulfonylurea drug in stable INS1E clones. Cells were cultured overnight at 2.8 mm glucose before analysis. Intracellular Ca2+ levels were detected with fura 2-AM fluorescent probe. A, representative diagram of a measurement of intracellular calcium in response to 100 μm tolbutamide (Tolb). B, intracellular Ca2+ mobilization in response to 100 μm tolbutamide. Values represent the difference of the ratio F340/F380 between the minimum and the maximum tolbutamide stimulation (n = 192–201). **, p < 0.01 versus control cells. Results are expressed as mean ± S.E.

