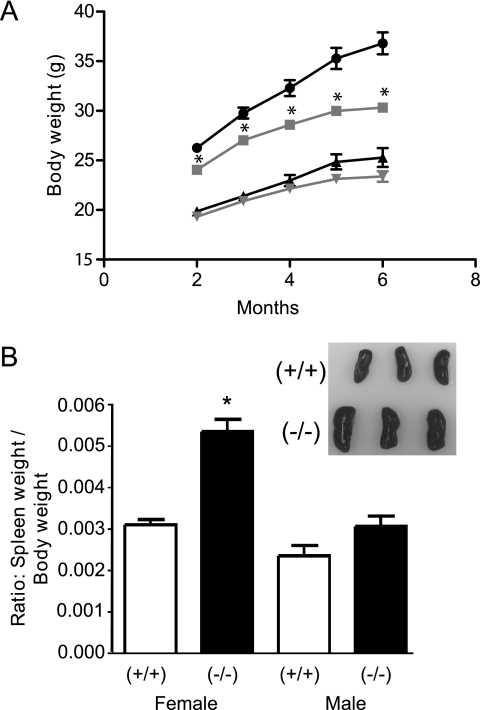
FIGURE 3.
Phenotypic differences between PP5−/− and PP5+/+ mice. A, comparison of body weights between PP5−/− (gray lines) and PP5+/+ (black lines) mice with time. Circles and squares represent male mice; triangles and inverted triangles represent females. B, comparison of spleen weight in male and female mice at ∼1 year of age plotted as a ratio of spleen weight to total body weight. The data shown are the means ± S.E., n = 10–22. The asterisk indicates a statistically significant difference between PP5−/− and PP5+/+ animals (p < 0.05) by two-way ANOVA (A) and one-way ANOVA (B).

