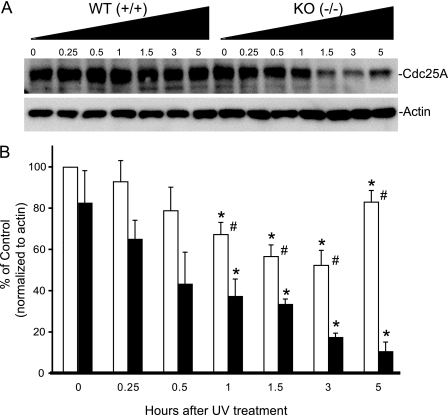
FIGURE 6.
Changes in Cdc25A levels in MEFs following treatment with UV light. MEFs produced from wild-type PP5+/+ or PP5 disrupted PP5−/− mice were treated with UV light as in Fig. 5. At the time indicated, the cells were harvested and processed for Western analysis using an antibody that recognizes Cdc25A. A, representative images illustrating changes in Cdc25A protein levels. B, quantitation of images from three separate experiments (mean ± S.E., n = 3); the asterisk indicates a statistically significant difference between UV treatment and untreated controls (p < 0.05); # indicates a statistically significant difference between PP5+/+ and PP5−/− MEFs receiving identical treatment (p < 0.05) by two-way ANOVA.

