FIGURE 2.
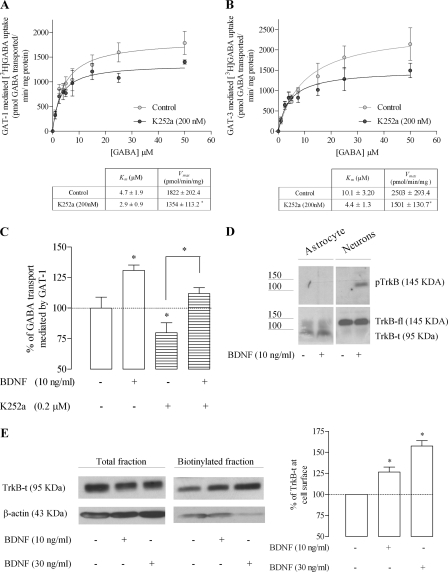
BDNF modulates GAT-1 through activation of the TrkB-t receptor. Saturation analysis of GAT-1 (A) and GAT-3 (B) transport is shown. Cells were incubated in the absence (open circles) or presence of K252a (filled circles) before the addition of [3H]GABA at the concentrations indicated on the abscissa; data shown in the upper panel are the mean values from five experiments performed in quadruplicate (four wells per GABA concentration), the averaged Km and Vmax values being shown in the lower panel; *, p < 0.05 (Student's t test, as compared with control). C, effect of BDNF upon [3H]GABA uptake in the presence or absence of K252a; *, p < 0.05 (one-way ANOVA followed by Bonferroni's post-test, as compared with control conditions (first bar on the left) except where otherwise indicated by the connecting lines above the bars. D, analysis of TrkB and pTrkB staining in total lysates of astrocytes or neurons treated with/without BDNF, as indicated. E, Western blot analysis of TrkB-t immunoreactivity in cell lysates and biotinylated fractions of astrocytes. In the left panel is shown a representative immunoblot, and the right panel depicts the quantitative densitometric analysis of the immunoreactivity in the biotinylated fraction. Blots were probed with anti-TrkB (1:1000), and β-actin immunolabeling (1:10,000) was used as a loading control. In C, 100% on the ordinate corresponds to the amount of [3H]GABA taken up by astrocytes in the same experiments in the absence of any drug. In E, 100% on the ordinate corresponds to TrkB-t staining in the absence of BDNF, after normalization for β-actin immunoreactivity. The results are expressed as mean ± S.E. (error bars) from five (A and B), six (C), or four (E) independent experiments.

