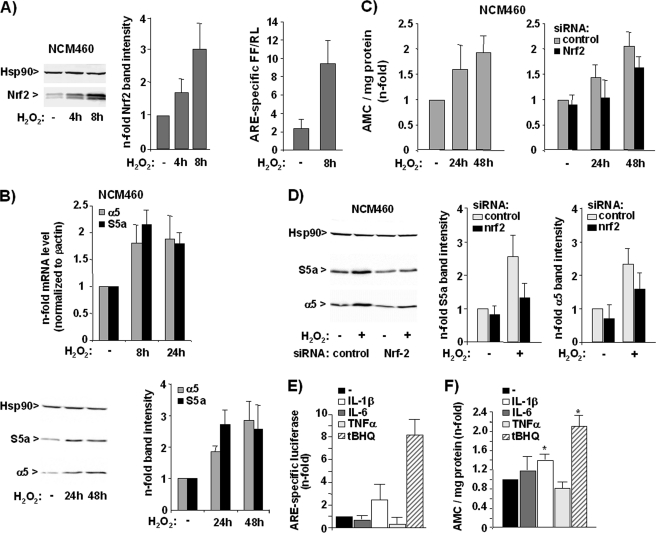
FIGURE 5.
H2O2 induces Nrf2-dependent proteasome activity in NCM460 cells. A, NCM460 cells were transiently treated with H2O2 at 200 μm, and nuclear extracts were analyzed by immunoblotting using Nrf2 and Hsp90 antibodies (left panel, a representative blot; middle panel, normalized Nrf2 band intensities from three independent experiments; means ± S.D.), or NCM460 cells were transfected with pARE or the control (pGL3) firefly luciferase reporter vector together with ptkRL prior to H2O2 treatment, and then cells were submitted to dual luciferase assay (right panel, data from three independent experiments performed in duplicate are shown). B, NCM460 cells were transiently treated with H2O2 at 200 μm, and reverse transcribed mRNA was submitted to real time PCR using S5a, α5, and β-actin primers (upper panel, mean values from three independent experiments performed in duplicate), or cellular extracts were analyzed by immunoblotting using S5a, α5, and Hsp90 antibodies (lower panel, a representative blot and normalized band intensities from three representative experiments; means ± S.D.). C, untreated NCM460 cells (left panel) or NCM460 cells pretreated with control, Nrf1, and Nrf2 siRNA (right panel) were transiently exposed to H2O2 at 200 μm and then submitted to the Suc-LLVY-AMC assay; data (means ± S.D.) from three independent experiments are shown. D, NCM460 cells treated with control, Nrf1, and Nrf2 siRNA and then subjected to treatment with 200 μm H2O2 for 24 h were analyzed by S5a and α5 Western blotting. A representative blot (left panel) and the normalized S5a and α5 band intensities (right panel) from three independent experiments as determined by band densitometry are shown (means ± S.D.). E and F, NCM460 cells were analyzed by ARE luciferase assay and Suc-LLVY-AMC assay after treatment with the indicated stimuli for 24 h; data (means ± S.D.) from three (E) and five (F) independent experiments performed in duplicate are shown. *, p < 0.05 compared with untreated.

