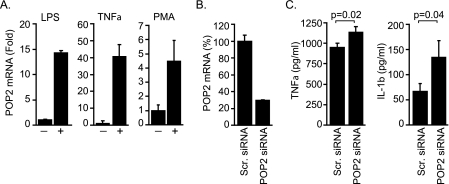
FIGURE 1.
Expression and function of POP2 in THP-1 cells. A, quantitative real-time RT-PCR showing POP2 mRNA expression in THP-1 cells stimulated with LPS or TNFα (+) for 1 h and with PMA for 12 h. Results are represented as -fold induction over untreated controls (−). All reactions were run in triplicates, and values were normalized to β-actin as internal control. B, POP2 mRNA knockdown in THP-1 cells following transfection with POP2-specific siRNA or scrambled (Scr.) siRNA as control. C, siRNA-transfected THP-1 cells were treated overnight with PMA, washed, and stimulated with LPS for 6 h. TNFα and IL-1β production was measured in culture supernatant using CBA and is shown as the mean ± S.E. of three experiments.

