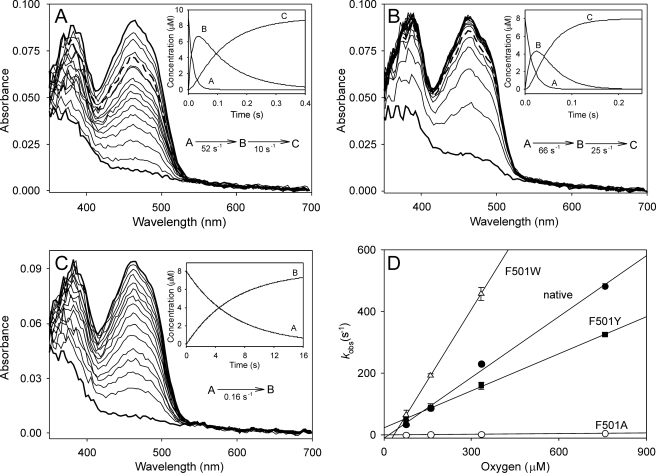
FIGURE 5.
Oxidative half-reaction: spectral changes during reaction of reduced AAO F501Y (A), F501W (B), and F501A (C) variants with O2 and reoxidation dependence on concentration (D). The spectral changes were followed after mixing ∼9 μm reduced enzyme with 0.1 m phosphate (pH 6) containing 76 μm O2 in the stopped-flow spectrophotometer at 12 °C. Spectra are shown after different reaction times (2, 9, 17, 24, 32, 40, 47, 55, 63, 70, 86, 93, 109, 117, 125, 150, 175, 200, and 250 ms in A and B and 40, 860, 1680, 2450, 3320, 4140, 5780, 6590, 7410, 8230, 9050, 10,700, 12,330, 13,970, and 15,600 ms in C). The insets show the simulated concentration dependence of the spectral species obtained after globally fitting the experimental data to one-step (A→B) and two-step (A→B→C) models. Spectra where species A (bottom thick lines), B (thick dashed lines in A and B), and C (top thick lines) were predominant are indicated in the main panels. Native AAO (not shown) showed spectral changes similar to those of the F501Y variant (A). To study the reoxidation dependence on O2 concentration (D), samples of reduced AAO and its F501W, F501Y, and F501A variants were mixed with buffer equilibrated at 76, 160, 334, and 760 μm O2 under the same conditions described above, and the fastest observed reoxidation rates (kobs corresponding to the A→B step) were estimated at 462 nm.

