FIGURE 5.
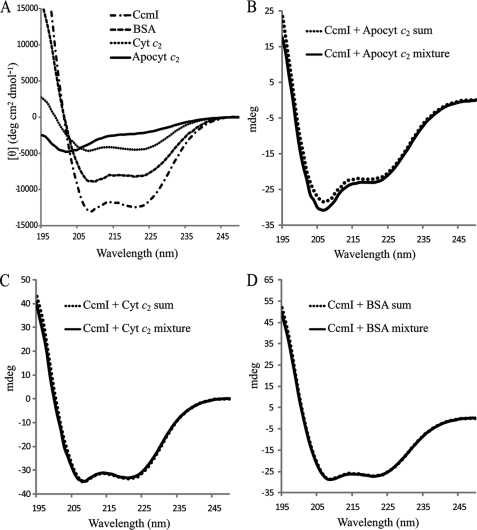
Circular dichroism spectra to monitor binding apocytochrome c2 to CcmI. Panel A, shown are far-UV (195–250 nm) CD spectra of 1.5 μm CcmI, 15 μm apocytochrome c2 (Apocyt c2), 15 μm cytochrome c2 (Cyt c2), and 1 μm BSA in 20 mm sodium phosphate buffer, pH 7.5, recorded at 25 °C. A CD spectrum of apocytochrome c2 indicates a disordered random coil conformation, and the CD spectra of CcmI, BSA, and cytochrome c2 show typical features of α-helical proteins. Panel B, shown is a comparison of the CD spectra of the (CcmI + Apocyt c2) mixture after 2 h of incubation at 25 °C with the sum of the individual spectrum of each protein. Panel C, shown is a comparison of the CD spectra of the (CcmI + Cyt c2) mixture with the sum of the corresponding individual spectrum of each protein as in B. Panel D, shown is a comparison of the CD spectra of the (CcmI + BSA) mixture with the sum of the corresponding individual spectrum of each protein as in C. Note that only the (CcmI + Apocyt c2) mixture shows a spectrum that is different from the sum of the individual spectra.

